The inflation rate in the USA was around 6.5% in 2022, which was lower than the previous year.
What is Inflation Rate
The inflation rate refers to the percentage increase in the general level of prices of goods and services in an economy over a specific period, usually a year. It is a measure of how much the cost of living has gone up over time, which can impact the purchasing power of consumers and the overall economy. The inflation rate is calculated by comparing the current prices of a basket of goods and services with the prices of the same basket in a previous period. A high inflation rate can lead to lower economic growth and can be a cause for concern for policymakers.
U.S. Inflation Rate History 1929 – 2023
| YEAR | INFLATION RATE YOY | FED FUNDS RATE
|
BUSINESS CYCLE (GDP GROWTH) | EVENTS AFFECTING INFLATION |
|---|---|---|---|---|
| 1929 | 0.6% | NA | August peak | Market crash |
| 1930 | -6.4% | NA | Contraction (-8.5%) | Smoot-Hawley |
| 1931 | -9.3% | NA | Contraction (-6.4%) | Dust Bowl |
| 1932 | -10.3% | NA | Contraction (-12.9%) | Hoover tax hikes |
| 1933 | 0.8% | NA | Contraction ended in March (-1.2%) | FDR’s New Deal |
| 1934 | 1.5% | NA | Expansion (10.8%) | U.S. debt rose |
| 1935 | 3.0% | NA | Expansion (8.9%) | Social Security |
| 1936 | 1.4% | NA | Expansion (12.9%) | FDR tax hikes |
| 1937 | 2.9% | NA | Expansion peaked in May (5.1%) | Depression resumes |
| 1938 | -2.8% | NA | Contraction ended in June (-3.3%) | Depression ended |
| 1939 | 0.0% | NA | Expansion (8.0% | Dust Bowl ended |
| 1940 | 0.7% | NA | Expansion (8.8%) | Defense increased |
| 1941 | 9.9% | NA | Expansion (17.7%) | Pearl Harbor |
| 1942 | 9.0% | NA | Expansion (18.9%) | Defense spending |
| 1943 | 3.0% | NA | Expansion (17.0%) | Defense spending |
| 1944 | 2.3% | NA | Expansion (8.0%) | Bretton Woods |
| 1945 | 2.2% | NA | Feb. peak, Oct. trough (-1.0%) | Truman ended WWII |
| 1946 | 18.1% | NA | Expansion (-11.6%) | Budget cuts |
| 1947 | 8.8% | NA | Expansion (-1.1%) | Cold War spending |
| 1948 | 3.0% | NA | Nov. peak (4.1%) | |
| 1949 | -2.1% | NA | Oct trough (-0.6%) | Fair Deal, NATO |
| 1950 | 5.9% | NA | Expansion (8.7%) | Korean War |
| 1951 | 6.0% | NA | Expansion (8.0%) | |
| 1952 | 0.8% | NA | Expansion (4.1%) | |
| 1953 | 0.7% | NA | July peak (4.7%) | Eisenhower ended Korean War |
| 1954 | -0.7% | 1.25% | May trough (-0.6%) | Dow returned to 1929 high |
| 1955 | 0.4% | 2.50% | Expansion (7.1%) | |
| 1956 | 3.0% | 3.00% | Expansion (2.1%) | |
| 1957 | 2.9% | 3.00% | Aug. peak (2.1%) | Recession |
| 1958 | 1.8% | 2.50% | April trough (-0.7%) | Recession ended |
| 1959 | 1.7% | 4.00% | Expansion (6.9%) | Fed raised rates |
| 1960 | 1.4% | 2.00% | April peak (2.6%) | Recession |
| 1961 | 0.7% | 2.25% | Feb. trough (2.6%) | JFK’s deficit spending ended recession |
| 1962 | 1.3% | 3.00% | Expansion (6.1%) | |
| 1963 | 1.6% | 3.5% | Expansion (4.4%) | |
| 1964 | 1.0% | 3.75% | Expansion (5.8%) | LBJ Medicare, Medicaid |
| 1965 | 1.9% | 4.25% | Expansion (6.5%) | |
| 1966 | 3.5% | 5.50% | Expansion (6.6%) | Vietnam War |
| 1967 | 3.0% | 4.50% | Expansion (2.7%) | |
| 1968 | 4.7% | 6.00% | Expansion (4.9%) | Moon landing |
| 1969 | 6.2% | 9.00% | Dec. peak (3.1%) | Nixon took office |
| 1970 | 5.6% | 5.00% | Nov. trough (0.2%) | Recession |
| 1971 | 3.3% | 5.00% | Expansion (3.3%) | Wage-price controls |
| 1972 | 3.4% | 5.75% | Expansion (5.3%) | Stagflation |
| 1973 | 8.7% | 9.00% | Nov. peak (5.6%) | End of gold standard |
| 1974 | 12.3% | 8.00% | Contraction (-0.5%) | Watergate |
| 1975 | 6.9% | 4.75% | March trough (-0.2%) | Stop-gap monetary policy confused businesses and kept prices high |
| 1976 | 4.9% | 4.75% | Expansion (5.4%) | |
| 1977 | 6.7% | 6.50% | Expansion (4.6%) | |
| 1978 | 9.0% | 10.00% | Expansion (5.5%) | |
| 1979 | 13.3% | 12.00% | Expansion (3.2%) | |
| 1980 | 12.5% | 18.00% | Jan. peak (-0.3%) | Recession |
| 1981 | 8.9% | 12.00% | July trough (2.5%) | Reagan tax cut |
| 1982 | 3.8% | 8.50% | November (-1.8%) | Recession ended |
| 1983 | 3.8% | 9.25% | Expansion (4.6%) | Military spending |
| 1984 | 3.9% | 8.25% | Expansion (7.2%) | |
| 1985 | 3.8% | 7.75% | Expansion (4.2%) | |
| 1986 | 1.1% | 6.00% | Expansion (3.5%) | Tax cut |
| 1987 | 4.4% | 6.75% | Expansion (3.5%) | Black Monday crash |
| 1988 | 4.4% | 9.75% | Expansion (4.2%) | Fed raised rates |
| 1989 | 4.6% | 8.25% | Expansion (3.7%) | S&L Crisis |
| 1990 | 6.1% | 7.00% | July peak (1.9%) | Recession |
| 1991 | 3.1% | 4.00% | Mar trough (-0.1%) | Fed lowered rates |
| 1992 | 2.9% | 3.00% | Expansion (3.5%) | NAFTA drafted |
| 1993 | 2.7% | 3.00% | Expansion (2.8%) | Balanced Budget Act |
| 1994 | 2.7% | 5.50% | Expansion (4.0%) | |
| 1995 | 2.5% | 5.50% | Expansion (2.7%) | |
| 1996 | 3.3% | 5.25% | Expansion (3.8%) | Welfare reform |
| 1997 | 1.7% | 5.50% | Expansion (4.4%) | Fed raised rates |
| 1998 | 1.6% | 4.75% | Expansion (4.5%) | LTCM crisis |
| 1999 | 2.7% | 5.50% | Expansion (4.8%) | Glass-Steagall repealed |
| 2000 | 3.4% | 6.50% | Expansion (4.1%) | Tech bubble burst |
| 2001 | 1.6% | 1.75% | March peak, Nov. trough (1.0%) | Bush tax cut, 9/11 attacks |
| 2002 | 2.4% | 1.25% | Expansion (1.7%) | War on Terror |
| 2003 | 1.9% | 1.00% | Expansion (2.9%) | JGTRRA |
| 2004 | 3.3% | 2.25% | Expansion (3.8%) | |
| 2005 | 3.4% | 4.25% | Expansion (3.5%) | Katrina, Bankruptcy Act |
| 2006 | 2.5% | 5.25% | Expansion (2.9%) | |
| 2007 | 4.1% | 4.25% | Dec peak (1.9%) | Bank crisis |
| 2008 | 0.1% | 0.25% | Contraction (-0.1%) | Financial crisis |
| 2009 | 2.7% | 0.25% | June trough (-2.5%) | ARRA |
| 2010 | 1.5% | 0.25% | Expansion (2.6%) | ACA, Dodd-Frank Act |
| 2011 | 3.0% | 0.25% | Expansion (1.6%) | Debt ceiling crisis |
| 2012 | 1.7% | 0.25% | Expansion (2.2%) | |
| 2013 | 1.5% | 0.25% | Expansion (1.8%) | Government shutdown. Sequestration |
| 2014 | 0.8% | 0.25% | Expansion (2.5%) | QE ends |
| 2015 | 0.7% | 0.50% | Expansion (3.1%) | Deflation in oil and gas prices |
| 2016 | 2.1% | 0.75% | Expansion (1.7%) | |
| 2017 | 2.1% | 1.50% | Expansion (2.3%) | |
| 2018 | 1.9% | 2.50% | Expansion (3.0%) | |
| 2019 | 2.3% | 1.75% | Expansion (2.2%) | |
| 2020 | 1.4% | 0.25% | Contraction (-3.4%) | COVID-19 |
| 2021 | 7.0% | 0.25% | Expansion (5.9%) | COVID-19 |
| 2022 | 6.5% | 4.25% | Contraction (-1.6%) | |
| 2023 | 2.7% (est.) | 2.8% (est.) | Expansion (2.2%) | March 2022 projection |
| 2024 | 2.3% (est.) | 2.8% (est.) | Expansion (2.0%) | March 2022 projection |
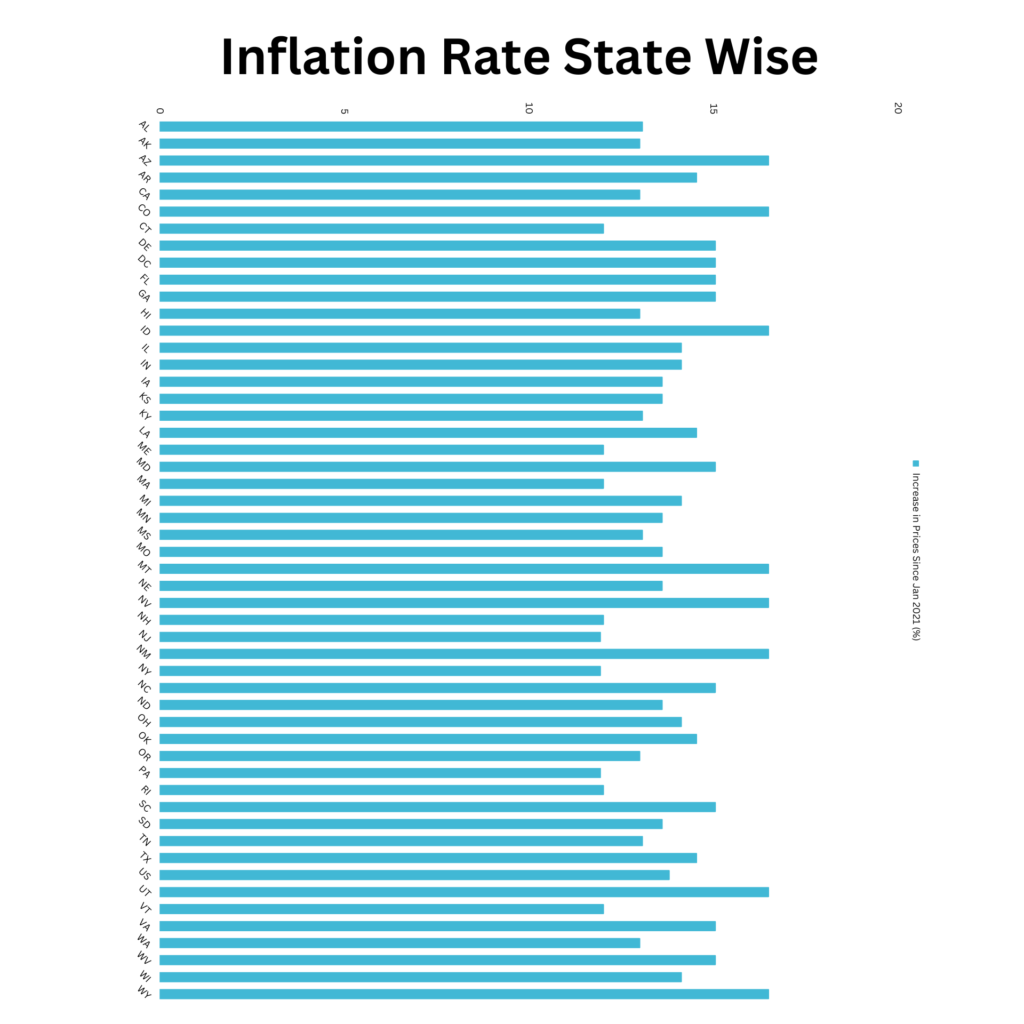
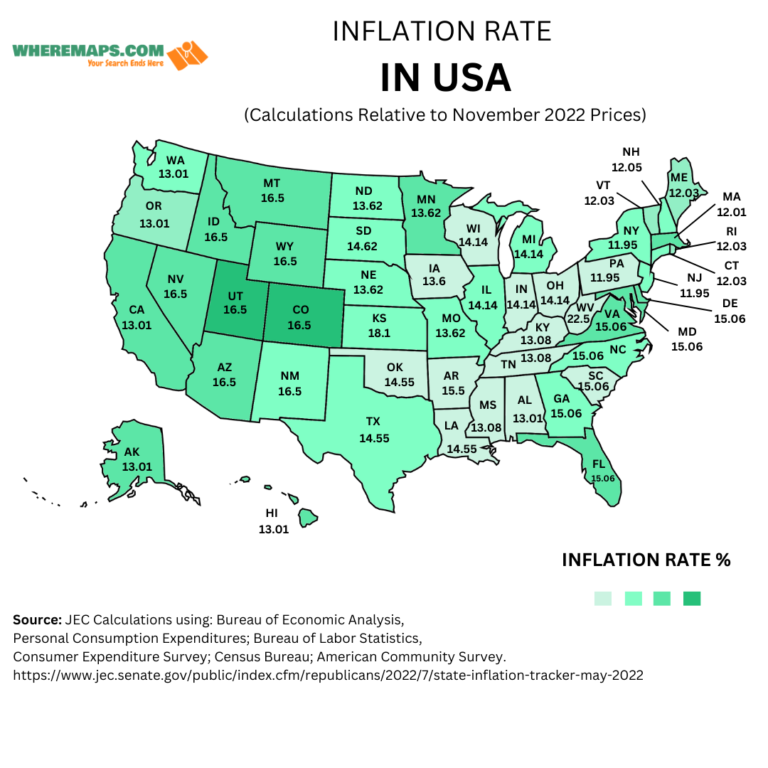
U.S. Inflation Rate State Wise
| State | State Code | Increase in Prices (%) |
| Alabama | AL | 13.09 |
| Alaska | AK | 13.02 |
| Arizona | AZ | 16.50 |
| Arkansas | AR | 14.55 |
| California | CA | 13.02 |
| Colorado | CO | 16.50 |
| Connecticut | CT | 12.03 |
| Delaware | DE | 15.06 |
| District of Columbia | DC | 15.06 |
| Florida | FL | 15.06 |
| Georgia | GA | 15.06 |
| Hawaii | HI | 13.02 |
| Idaho | ID | 16.50 |
| Illinois | IL | 14.14 |
| Indiana | IN | 14.14 |
| Iowa | IA | 13.62 |
| Kansas | KS | 13.62 |
| Kentucky | KY | 13.09 |
| Louisiana | LA | 14.55 |
| Maine | ME | 12.03 |
| Maryland | MD | 15.06 |
| Massachusetts | MA | 12.03 |
| Michigan | MI | 14.14 |
| Minnesota | MN | 13.62 |
| Mississippi | MS | 13.09 |
| Missouri | MO | 13.62 |
| Montana | MT | 16.50 |
| Nebraska | NE | 13.62 |
| Nevada | NV | 16.50 |
| New Hampshire | NH | 12.03 |
| New Jersey | NJ | 11.95 |
| New Mexico | NM | 16.50 |
| New York | NY | 11.95 |
| North Carolina | NC | 15.06 |
| North Dakota | ND | 13.62 |
| Ohio | OH | 14.14 |
| Oklahoma | OK | 14.55 |
| Oregon | OR | 13.02 |
| Pennsylvania | PA | 11.95 |
| Rhode Island | RI | 12.03 |
| South Carolina | SC | 15.06 |
| South Dakota | SD | 13.62 |
| Tennessee | TN | 13.09 |
| Texas | TX | 14.55 |
| Utah | UT | 16.50 |
| Vermont | VT | 12.03 |
| Virginia | VA | 15.06 |
| Washington | WA | 13.02 |
| West Virginia | WV | 15.06 |
| Wisconsin | WI | 14.14 |
| Wyoming | WY | 16.50 |
Note: This data is from Jan 2021
FAQs
Q: What is the highest inflation rate in U.S. history?
A: After the introduction of the CPI, the highest inflation rate observed was 20.49% in 1917.
Q: What Is the Consumer Price Index (CPI)?
A: The Consumer Price Index (CPI) measures the monthly change in prices paid by U.S.A consumers.
Q: What is the difference between inflation and deflation?
A: Inflation is an increase in the general level of prices of goods and services in an economy, whereas deflation is a decrease in the general level of prices. Inflation erodes the value of money, while deflation increases the value of money.